The term Internet of Things (IoT) gets used a lot but too often it’s explained in abstract diagrams or glossy marketing slides. This demo project was created to do something different, show a complete, working IoT system, end to end, using the same tools and patterns found in real-world deployments.
This is not a simulation running entirely in a browser. It’s a real device (or a realistic stand-in), publishing live data, being controlled remotely, and feeding a production-style data pipeline exactly how modern IoT systems operate.
What This Demo Is Designed to Show
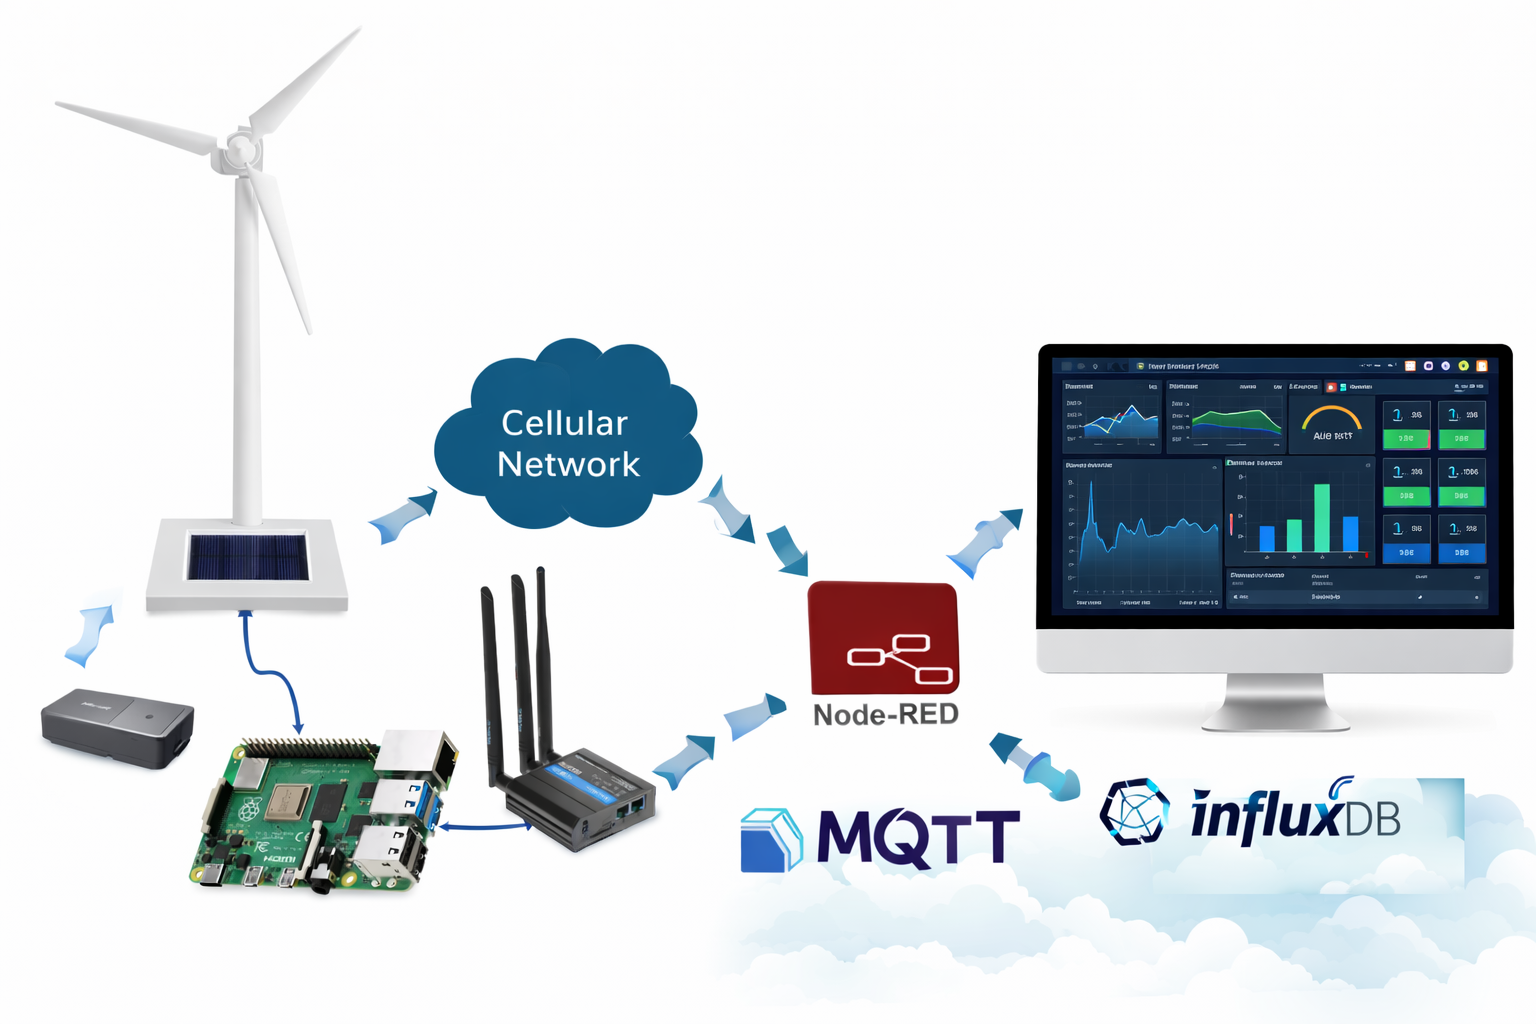
At its core, this project demonstrates how:
- Physical devices collect and publish data
- Cloud-side systems ingest, route, and store telemetry
- Dashboards visualise both live and historical information
- Devices can be managed and reconfigured remotely
- IoT systems cope with real-world network constraints
The demo focuses on renewable energy monitoring, switching between simulated solar and wind generation, but the underlying architecture is applicable to almost any IoT use case.
The Device Layer
The device is based on a Raspberry Pi with analogue inputs, representing energy generation sources.
Key characteristics:
- Data is sampled at 1Hz, each reading timestamped
- Voltage values are realistic (~240V ±5%)
- The device supports two sources: solar and wind
- A motor is activated automatically when wind mode is enabled
- All configuration is performed remotely
Crucially, the device sits behind a cellular NAT, meaning it cannot accept inbound connections. This mirrors how many real IoT deployments work in the field — and forces the system to be designed properly.
Messaging & Control with MQTT
All telemetry and configuration flows through MQTT, a lightweight publish/subscribe protocol widely used in IoT.
This enables:
- Secure outbound-only communication from the device
- Remote configuration changes without redeploying code
- Flexible update intervals (from seconds to minutes)
- A clean separation between device and application logic
The device is always the source of truth for its own state, while remaining fully manageable from the server side.
Data Routing with Node-RED
Once data reaches the broker, Node-RED handles:
- Validation and transformation of messages
- Routing data to the correct storage
- Ensuring demo and real data follow the same path
This is an important design choice: demo data is never “faked” at the dashboard. It flows through the same infrastructure as real device data, ensuring accuracy and credibility.
Time-Series Storage with InfluxDB
All measurements are written to InfluxDB, a purpose-built time-series database.
This allows:
- Efficient storage of high-frequency telemetry
- Fast historical queries
- Clean separation of measurements (solar, wind, motor state)
- Reliable graphing and trend analysis
The Web Dashboard
The front end is a Flask-based web application that provides:
- Live system status
- Historical graphs
- Active energy source visibility
- Motor state indication
- User authentication and admin controls
- Alerting infrastructure
- A built-in blog for IoT commentary and updates
This turns the demo into both a technical showcase and a content platform.
Demo Mode: Realistic, Safe, and Useful
To make the system easy to demonstrate, a built-in demo mode is included.
In demo mode:
- Solar data is generated for a fixed period
- The system automatically switches to wind
- The motor activates accordingly
- All values remain realistic
- Data is indistinguishable from real device data downstream
This makes the project ideal for live demonstrations, testing, screenshots, and presentations without requiring permanent hardware setup.
Why This Approach Matters
Many IoT demos stop at UI mock-ups or isolated scripts. This project deliberately avoids that by:
- Using production-grade tools
- Respecting real networking constraints
- Maintaining a single data pipeline
- Designing for extension and scale
The result is a system that doesn’t just look like IoT, it behaves like it.